Performance Analysis and Comparison of h2o and akka-http
TL;DR)
- For the TechEmpower hello-world benchmark, h2o performs much better than akka-http, probably because of 1) less unnecessary user-land code execution and 2) less thread switching
- Need more insights from Java profilers to understand bottlenecks in akka-http
Overview
My last article covered how to run TechEmpower Web Framework Benchmarks on AWS with CloudFormation:
In this article, I compare h2o, which I have been playing around on in the recent articles with akka-http, my favorite web framework. On the TechEmpower 17th round page, they are compared as follows:
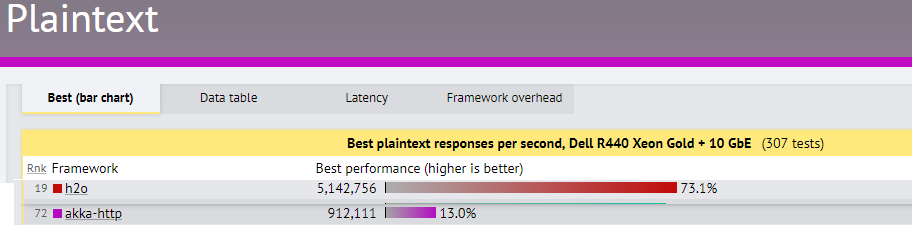
It looks like akka-http isn't performing well compared to h2o for this benchmark and I'll investigate why, using Linux performance analysis tools. In the end I conclude that application-level tools like Java profilers would be needed for further insights, but I'll go as far as I can with the Linux tools.
Anyway, remember that benchmark results are measurements from only certain perspectives of the performance. They don't necessarily explain general performance characteristics of your system or component.
wrk results
Here's the summary of wrk results from my run. As in my earlier article, they were run on AWS m5.xlarge EC2 instances.
h2o:       Running 15s test, 4 threads and 256 connections
akka-http: Running 15s test, 4 threads and 256 connections
Thread Stats Avg Stdev Max +/- Stdev
h2o: Latency 4.46ms 3.16ms 221.43ms 76.37%
akka-http: Latency 33.13ms 128.55ms 1670.00ms 96.61%
h2o: Req/Sec 128.56k 29.05k 178.39k 78.69%
akka-http: Req/Sec 57.91k 11.27k 121.80k 88.00% Latency Distribution
h2o akka-http
50% 4.05ms 10.22ms
75% 5.94ms 17.15ms
90% 8.16ms 25.85ms
99% 13.70ms 797.84msh2o: 7653232 requests in 15.06s, 1.13GB read
akka-http: 3456956 requests in 15.05s, 464.85MB read
h2o: Requests/sec: 508095.42
akka-http: Requests/sec: 229653.55
h2o: Transfer/sec: 76.56MB
akka-http: Transfer/sec: 30.88MBBrendan Gregg's USE method
I followed Brendan Gregg's USE method to investigate the performance difference.
Brendan is a performance-analysis expert as described on his bio page:
Brendan Gregg is an industry expert in computing performance and cloud computing. He is a senior performance architect at Netflix, where he does performance design, evaluation, analysis, and tuning. He is the author of Systems Performance published by Prentice Hall ...
Following his USE method, I checked the following resources:
- CPU
- Memory
- Disk
and saw how many/much:
- utilization
- saturation
- errors
they had. Please refer to the above Brendan's page for more detail about the method.
I SSH-ed to the EC2 instances running h2o and akka-http respectively, and ran several Linux commands to analyze their resource usage.
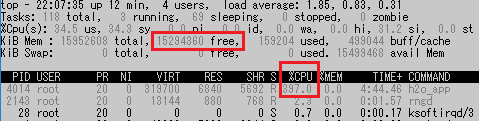
top
The first command I executed was top. Below are the screenshots of the top command results from the EC2 instances running h2o and akka-http. The (nearly) 400% usage of CPU and the plenty of free memory space indicate both of them are CPU-bound processes.
h2o:
akka-http:
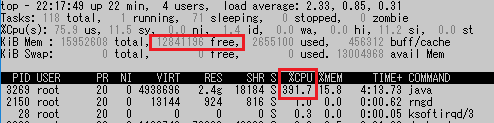
To confirm if they are really CPU bound processes, let's look further with other commands.
vmstat 1
vmstat 1 (the argument 1 means that results are update every 1 second.) confirmed that these h2o and akka-http processes are CPU-bound.
h2o:
procs -----------memory------------ ---swap-- -----io---- --system--- ------cpu------
 r  b   swpd     free   buff  cache   si   so    bi    bo     in   cs us sy  id wa st
 0  0      0 15295752   2088 496640    0    0     0     0    343  370  0  0 100  0  0
 4  0      0 15294180   2088 496908    0    0     0     2 121788 5375 21 44  35  0  0
 6  0      0 15294080   2088 496660    0    0     0     0 187081 7694 36 64   0  0  0
 5  0      0 15294256   2088 496732    0    0     0     0 187460 7652 34 66   0  0  0
 ...
 ...
 6  0      0 15294176   2088 496868    0    0     0     0 188814 7585 34 66   0  0  0
 5  0      0 15294280   2088 496452    0    0     0     0 188951 7603 34 66   0  0  0
 0  0      0 15295892   2088 496876    0    0     0     0 72842  3797 13 25  63  0  0
 0  0      0 15295892   2088 496876    0    0     0     0  416    369  0  0 100  0  0
 0  0      0 15295892   2088 496876    0    0     0     0  259    355  0  0 100  0  0
akka-http:
procs -----------memory----------   ---swap-- ---io------ ---system-- ------cpu------
 r  b   swpd     free   buff  cache   si   so    bi    bo   in     cs us sy  id wa st
 0  0      0 12846520   2088 454480    0    0     0     0   561   663  0  0 100  0  0
 5  0      0 12835724   2088 454696    0    0     0    20 58203 33816 55 15  30  0  0
 5  0      0 12835836   2088 454408    0    0     0     0 90021 46849 74 24   2  0  0
 6  0      0 12835744   2088 454408    0    0     0     0 91156 46652 76 23   1  0  0
 ...
 ...
 4  0      0 12840668   2088 454716    0    0     0     0 92746 45960 77 22   1  0  0
 0  0      0 12840800   2088 454728    0    0     0     0 32040 18220 28  8  64  0  0
 0  0      0 12840800   2088 454728    0    0     0     0    467  607  0  0 100  0  0
The man page explainis how to interpret the results.
For the CPU:
- Both have almost 100% CPU usage (below cs + us = nearly 100%)
- Both have the left-most
rcolumn >= 4, where 4 is the number of vCPUs
About the memory:
- Memory has plenty of free space, and the swap is not used (swpd = 0)
And for the I/O:
- not super huge saturation on the
bcolumn, waiting for I/O - bi (block-in) and bo (block-out) columns are both zero
Thus it would be okay to conclude these are CPU bound processes. Then there is some difference between h2o and akka-http as follows:
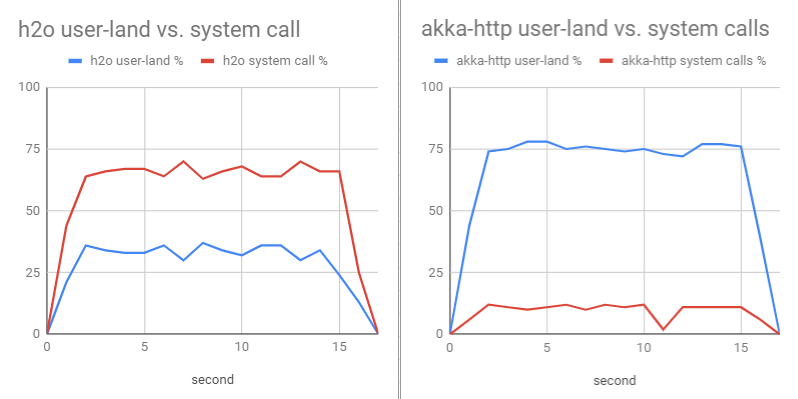
- From the
usandsycolumns under thecpusection:- h2o has 35% user-land code (us) vs. 65% system-call (sy) execution
- while akka-http has 75% us vs. 25% sy
other difference includes:
- akka-http consumes much more memory
- context switch is relatively high in akka-http
I've also run other commands like iostat, mpstat, but for this time, they don't provide more insights than what I discovered up to this point. Next, I'll look at what could be potentially causing the difference between h2o and akka-http.
strace
From here it gets bit more interesting than just seeing Linux command results.
I used the strace command to dump the Linux system calls and compared the results from h2o and akka-http.
The h2o results looked like this, having many writev calls to the 22th file descriptor. I checked proc/715/fd files and found that the file descriptor 22 was for a network socket, so the writev calls should be passing data to the Linux network stack.
[pid   715] writev(22, [{"HTTP/1.1 200 OK\r\nDate: Fri, 15 F"..., 145}, {"Hello, World!", 13}], 2) = 15
[pid   715] writev(22, [{"HTTP/1.1 200 OK\r\nDate: Fri, 15 F"..., 145}, {"Hello, World!", 13}], 2) = 15
[pid   715] writev(22, [{"HTTP/1.1 200 OK\r\nDate: Fri, 15 F"..., 145}, {"Hello, World!", 13}], 2) = 15
[pid   715] writev(22, [{"HTTP/1.1 200 OK\r\nDate: Fri, 15 F"..., 145}, {"Hello, World!", 13}], 2) = 15
[pid   715] writev(22, [{"HTTP/1.1 200 OK\r\nDate: Fri, 15 F"..., 145}, {"Hello, World!", 13}], 2) = 15
[pid   715] epoll_wait(14, [{EPOLLIN, {u32=805313536, u64=139746156223488}}, {EPOLLIN, {u32=805314592,
u64=139746156224544}}, {EPOLLIN, {u32=805315648, u64=139746156225600}}, {EPOLLIN, {u32=805329056, u64=1
39746156239008}}, {EPOLLIN, {u32=805330112, u64=139746156240064}}, {EPOLLIN, {u32=805331168, u64=139746
156241120}}, {EPOLLIN, {u32=805332224, u64=139746156242176}}, {EPOLLIN, {u32=805333280, u64=13974615624
3232}}, {EPOLLIN, {u32=805334336, u64=139746156244288}}, {EPOLLIN, {u32=805311424, u64=139746156221376}
}], 256, 9990) = 10
[pid   715] read(20, "GET /plaintext HTTP/1.1\r\nHost: 1"..., 8192) = 2640
[pid   715] writev(20, [{"HTTP/1.1 200 OK\r\nDate: Fri, 15 F"..., 145}, {"Hello, World!", 13}], 2) = 15
...
...
[pid   714] <... accept4 resumed> NULL, NULL, SOCK_CLOEXEC|SOCK_NONBLOCK) = 102
[pid   715] <... writev resumed> )      = 158
[pid   714] setsockopt(102, SOL_TCP, TCP_NODELAY, [1], 4 <unfinished ...>
[pid   715] writev(69, [{"HTTP/1.1 200 OK\r\nDate: Fri, 15 F"..., 145}, {"Hello, World!", 13}], 2 <unfinished ...>
[pid   714] <... setsockopt resumed> )  = 0
[pid   715] <... writev resumed> )      = 158
[pid   714] fcntl(102, F_SETFL, O_RDONLY|O_NONBLOCK <unfinished ...>
[pid   715] writev(69, [{"HTTP/1.1 200 OK\r\nDate: Fri, 15 F"..., 145}, {"Hello, World!", 13}], 2) = 158
[pid   714] <... fcntl resumed> )       = 0
[pid   715] writev(69, [{"HTTP/1.1 200 OK\r\nDate: Fri, 15 F"..., 145}, {"Hello, World!", 13}], 2 <unfinished ...>
[pid   714] accept4(21,  <unfinished ...>
[pid   715] <... writev resumed> )      = 158
I counted the number of lines having writev as follows:
> wc -l /tmp/strace.log | wc -l
1153344

> grep "writev(" /tmp/strace.log | wc -l
579104
and it roughly matches the number of HTTP requests from the wrk side. Note that the number of requests significantly dropped down from the previous run, due to the overhead of strace:
# wrk
575044 requests in 15.04s, 86.65MB read
Let's look into akka-http from here. Below is the strace output, and it is very different from that of h2o. There are a lot of futex calls, which might be something to do with context switching (?), and write to the network socket is done by write instead of writev:
[pid    71] epoll_wait(51, [{EPOLLIN, {u32=49, u64=139642271694897}}, {EPOLLIN, {u32=78, u64=78}}, {EPOLLIN, {u32=67, u64=67}}, {EPOLLIN, {u32=59, u64=59}}, {EPOLLIN, {u32=77, u64=77}}, {EPOLLIN, {u32=53, u64=53}}, {EPOLLIN, {u32=68, u64=68}}, {EPOLLIN, {u32=65, u64=65}}, {EPOLLIN, {u32=66, u64=66}}, {EPOLLIN, {u32=58, u64=58}}, {EPOLLIN, {u32=63, u64=63}}, {EPOLLIN, {u32=62, u64=62}}, {EPOLLIN, {u32=82, u64=82}}, {EPOLLIN, {u32=64, u64=64}}, {EPOLLIN, {u32=69, u64=69}}, {EPOLLIN, {u32=74, u64=74}}, {EPOLLIN, {u32=61, u64=61}}, {EPOLLIN, {u32=54, u64=54}}], 8192, 10000) = 18
[pid    71] read(49, "\1", 128)         = 1
[pid    71] futex(0x7f0198059804, FUTEX_WAKE_OP_PRIVATE, 1, 1, 0x7f0198059800, FUTEX_OP_SET<<28|0<<12|FUTEX_OP_CMP_GT<<24|0x1 <unfinished ...>
[pid    72] <... futex resumed> )       = 0
[pid    71] <... futex resumed> )       = 1
[pid    72] futex(0x7f01980597d8, FUTEX_WAIT_PRIVATE, 2, NULL <unfinished ...>
[pid    71] futex(0x7f01980597d8, FUTEX_WAKE_PRIVATE, 1 <unfinished ...>
[pid    72] <... futex resumed> )       = -1 EAGAIN (Resource temporarily unavailable)
[pid    71] <... futex resumed> )       = 0
[pid    72] futex(0x7f01980597d8, FUTEX_WAKE_PRIVATE, 1 <unfinished ...>
[pid    71] futex(0x7f01ee18f0f4, FUTEX_WAKE_OP_PRIVATE, 1, 1, 0x7f01ee18f0f0, FUTEX_OP_SET<<28|0<<12|FUTEX_OP_CMP_GT<<24|0x1 <unfinished ...>
[pid    72] <... futex resumed> )       = 0
[pid    71] <... futex resumed> )       = 1
[pid   114] <... futex resumed> )       = 0
[pid    72] futex(0x7f01ee1809e4, FUTEX_WAKE_OP_PRIVATE, 1, 1, 0x7f01ee1809e0, FUTEX_OP_SET<<28|0<<12|FUTEX_OP_CMP_GT<<24|0x1 <unfinished ...>
[pid   114] futex(0x7f01ee18f0c8, FUTEX_WAKE_PRIVATE, 1 <unfinished ...>
[pid   113] <... futex resumed> )       = 0
[pid   114] <... futex resumed> )       = 0
[pid   113] futex(0x7f01ee1809b8, FUTEX_WAIT_PRIVATE, 2, NULL <unfinished ...>
[pid   114] read(53,  <unfinished ...>
[pid    72] <... futex resumed> )       = 1
[pid    71] futex(0x7f01ee1925c4, FUTEX_WAKE_OP_PRIVATE, 1, 1, 0x7f01ee1925c0, FUTEX_OP_SET<<28|0<<12|FUTEX_OP_CMP_GT<<24|0x1 <unfinished ...>
[pid   114] <... read resumed> "GET /plaintext HTTP/1.1\r\nHost: 1"..., 131072) = 2640
[pid   115] <... futex resumed> )       = 0
[pid    72] futex(0x7f01ee1809b8, FUTEX_WAKE_PRIVATE, 1 <unfinished ...>
[pid   115] futex(0x7f01ee192598, FUTEX_WAIT_PRIVATE, 2, NULL <unfinished ...>
[pid    71] <... futex resumed> )       = 1
[pid   113] <... futex resumed> )       = 0
[pid    72] <... futex resumed> )       = 1
[pid   113] futex(0x7f01ee1809b8, FUTEX_WAKE_PRIVATE, 1 <unfinished ...>
[pid    72] read(77,  <unfinished ...>
[pid   113] <... futex resumed> )       = 0
[pid    72] <... read resumed> "GET /plaintext HTTP/1.1\r\nHost: 1"..., 131072) = 2640
[pid   113] read(67,  <unfinished ...>
[pid    71] futex(0x7f01ee192598, FUTEX_WAKE_PRIVATE, 1 <unfinished ...>
[pid   113] <... read resumed> "GET /plaintext HTTP/1.1\r\nHost: 1"..., 131072) = 2640
[pid    72] write(53, "HTTP/1.1 200 OK\r\nServer: akka-ht"..., 141 <unfinished ...>
[pid    71] <... futex resumed> )       = 1
[pid    72] <... write resumed> )       = 141
[pid    71] epoll_ctl(51, EPOLL_CTL_DEL, 77, 0x7f01d815f54c <unfinished ...>
[pid    72] read(78,  <unfinished ...>
[pid   114] write(53, "HTTP/1.1 200 OK\r\nServer: akka-ht"..., 2115 <unfinished ...>
[pid    72] <... read resumed> "GET /plaintext HTTP/1.1\r\nHost: 1"..., 131072) = 2640
[pid   114] <... write resumed> )       = 2115
[pid    72] read(59,  <unfinished ...>
[pid   114] read(68,  <unfinished ...>
[pid    72] <... read resumed> "GET /plaintext HTTP/1.1\r\nHost: 1"..., 131072) = 2640
[pid   114] <... read resumed> "GET /plaintext HTTP/1.1\r\nHost: 1"..., 131072) = 2640
[pid    72] read(62,  <unfinished ...>
[pid    71] <... epoll_ctl resumed> )   = 0
[pid    72] <... read resumed> "GET /plaintext HTTP/1.1\r\nHost: 1"..., 131072) = 2640
[pid    71] epoll_ctl(51, EPOLL_CTL_MOD, 53, {EPOLLIN, {u32=53, u64=53}} <unfinished ...>
[pid    72] read(66,  <unfinished ...>
[pid    71] <... epoll_ctl resumed> )   = 0
[pid    72] <... read resumed> "GET /plaintext HTTP/1.1\r\nHost: 1"..., 131072) = 2640
The number of lines in the file and the lines having write are as follows:
> wc -l /tmp/strace.log
1124047 /tmp/strace.log

> grep write /tmp/strace.log | wc -l
447411
Actually I didn't understand the implication from this as the number of lines of write doesn't match up at all with the number of wrk requests.
# wrk
1781629 requests in 15.04s, 239.57MB read
Also, interestingly akka-http with strace is more performant that h2o with strace. It shold be because the strace overhead is only for Linux system calls, not user-land code execution, and h2o is more system-call intensive for this benchmark.
Conclusion
The core work of this hello-world web server are receiving HTTP request payloads and sending HTTP response payloads back. It seems that it is done bia network file descriptors which represent the Linux network stack.
If a web server executes as less stuff as this core work, it will be faster. If the web server is doing more work, that would be slower. Looking at the results of Linux performance-analysis commands and strace log, the relative slowness of akka-http seems to be coming from more user-land work and more context switches,
Investigating what the rest of the work other than the core work requires app-level profilers like Java Flight Controller for JVM procs (akka-http). It would be done in other articles when I have more time to investigate further.