wrk for benchmarking and Firebase's Cloud Firestore to save results
Overview
We always want our code run fast, don't we? Who doesn't want their code run fast, so fast that kicks competitors out of the market?
To meet performance expectation, we should do performance analysis, upfront, on demand, post mortem, and iteratively. However, it is often cumbersome, so in reality we probably do adhoc analysis with heavy lifting, then forget about it and never revist the results afterwards.
To alleviate the situation, here I introduce techniques to run benchmark in a single command, and save results automatically in a JSON store, for analysis, comparison, or further processing.
Performance analysis is a vast field to explore, so benchmarking is only a part of the whole analysis activities. Hopefully this article still gives you a starting point to automate your performance analysis workflow.
This is a series of articles on the same topic, and in the next article, we containerize this workflow.
Resulting shell script in brief
We use wrk, "a modern HTTP benchmarking tool capable of generating significant load when run on a single multi-core CPU", jq to manipulate the JSON, and store the JSON benchmark results into Firebase Cloud Firestore automatically.
A shell script as follows will run the above three. The full script is available at my GitHub repository with brief instruction to run it. So if you want to just run it quickly, head over to the GitHub repo. If you want to know how it works please read on.
#!/bin/bash
# WRK performance test script

PROGNAME="wrk"

connections=4
duration=3
threads=2

#In the ISO 8601 format of '2018-10-21T15:59:45+09:00'
current_time=$(date -Iseconds)

# parse options, omitted as it is too long, but the everything avaialble at https://github.com/richardimaoka/wrk-and-firestore
# ...
# ...

# Executing WRK_CMD creates result_intermediate.json
WRK_CMD="wrk -t ${threads} -c ${connections} -d ${duration} -s wrk_json.lua ${TARGET_URL}"
${WRK_CMD}

# Augment re.json with metadata
echo "{ \
  \"metadata\": { \
    \"execution_time\":   \"$current_time\", \
    \"connections\":      $connections, \
    \"duration_seconds\": $duration, \
    \"num_threads\":      $threads \
  } \
}" > result_metadata.json
jq -s '.[0] * .[1]' result_metadata.json result_intermediate.json > result.json

node upload-to-firestore.js
wrk
There is a wide variety of HTTP benchmarking tools, ranging from Apache Bench for simple HTTP request/response benchmarking, to those like Apache JMeter and Gatling with scenario-based HTTP testing capabilities. Other than HTTP benchmarking, jmh is part of Open JDK for JVM benchmarking, and also browser-based benchmark tools available too. Of course, there are a lot, lot more.
Similar to Apache Bench, wrk can measure simple HTTP request/response performance, but not suited for complex scenario-based HTTP benchmarking. We chose wrk as it can generate sufficient HTTP loads from a single process, without a cluster of master-slave processes, and its scripting capabilities let us write the benchmark result in JSON.
When we run wrk, we get a result like this in stdout.
> wrk -t12 -c400 -d30s http://127.0.0.1:8080/index.html

Running 30s test @ http://127.0.0.1:8080/index.html
  12 threads and 400 connections
  Thread Stats   Avg      Stdev     Max   +/- Stdev
    Latency   635.91us    0.89ms  12.92ms   93.69%
    Req/Sec    56.20k     8.07k   62.00k    86.54%
  22464657 requests in 30.00s, 17.76GB read
Requests/sec: 748868.53
Transfer/sec:    606.33MB
The result is just plain text, not JSON. So we would do some tweaks later.
To get started with wrk, visit the wrk instalation guide. We can use brew for Mac, apt/yum for Linux, and Unbuntu on WSL for Windows.
As in the above command example, we can give options to the wrk command. In this article, what we are interested in are these these four optoins.
-c, --connections: total number of HTTP connections to keep open with
                   each thread handling N = connections/threads

-d, --duration:    duration of the test, e.g. 2s, 2m, 2h

-t, --threads:     total number of threads to use

-s, --script:      LuaJIT script, see SCRIPTING
Following an example in a [GitHub PR] (https://github.com/wg/wrk/pull/361/files) in the official wrk repository (not merged yet), and the scripting guide we can do this to write the JSON results into a file.
-- wrk_json.lua: example script for creating json file report

function done(summary, latency, requests)
  file = io.open('result_intermediate.json', 'w')
  io.output(file)

  io.write(string.format("{\n"))

  io.write(string.format("  \"summary\": {\n"))
  io.write(string.format("    \"duration_microseconds\": %d,\n",      summary.duration))
  io.write(string.format("    \"num_requests\":          %d,\n",      summary.requests))
  io.write(string.format("    \"total_bytes\":           %d,\n",      summary.bytes))
  io.write(string.format("    \"requests_per_sec\":      %.2f,\n",    summary.requests/(summary.duration)))
  io.write(string.format("    \"bytes_per_sec\":         \"%.2f\"\n", summary.bytes/summary.duration))
  io.write(string.format("  },\n"))

  io.write(string.format("  \"latency\": {\n"))
  io.write(string.format("    \"min_microseconds\":           %.2f,\n", latency.min))
  io.write(string.format("    \"max_microseconds\":           %.2f,\n", latency.max))
  io.write(string.format("    \"mean_microseconds\":          %.2f,\n", latency.mean))
  io.write(string.format("    \"stdev_microseconds\":         %.2f,\n", latency.stdev))
  io.write(string.format("    \"percentile_90_microseconds\": %.2f,\n", latency:percentile(90.0)))
  io.write(string.format("    \"percentile_95_microseconds\": %.2f,\n", latency:percentile(95.0)))
  io.write(string.format("    \"percentile_99_microseconds\": %.2f\n",  latency:percentile(99.0)))
  io.write(string.format("  }\n"))


  io.write(string.format("}\n"))
end
Start a whatever web server you like - if you have docker, the easiest way is:
> docker run -d -p 8080:80 nginx:latestthen run the wrk command with the -s option:
> wrk -t2 -c4 -d3s -swrk_json.lua http://localhost:8080This will give us a resulting JSON file, result_intermediate.json.
{
  "summary": {
    "duration_microseconds": 3098574,
    "num_requests":          10378,
    "total_bytes":           8821266,
    "requests_per_sec":      0.00,
    "bytes_per_sec":         "2.85"
  },
  "latency": {
    "min_microseconds":           346.00,
    "max_microseconds":           33038.00,
    "mean_microseconds":          1733.07,
    "stdev_microseconds":         2467.11,
    "percentile_90_microseconds": 3657.00,
    "percentile_95_microseconds": 6884.00,
    "percentile_99_microseconds": 12993.00
  }
}
The reason we put the result into a file, instead of stdout, is because wrk does not have an option to turn off the default output like below:
Running 30s test @ http://127.0.0.1:8080/index.html
  12 threads and 400 connections
  Thread Stats   Avg      Stdev     Max   +/- Stdev
    Latency   635.91us    0.89ms  12.92ms   93.69%
    Req/Sec    56.20k     8.07k   62.00k    86.54%
  22464657 requests in 30.00s, 17.76GB read
Requests/sec: 748868.53
Transfer/sec:    606.33MB
so if you use print in wrk_json.lua instead of io.write to file, we will get a mixed result of plain text and JSON.
jq
So far we got the JSON output which tells us the benchmark results, but we want to add extra metadata fields using jq.
Why do we need to do that, instead of creating a complete JSON file in the Lua script executed by wrk? Looking at the wrk scripting guide again, currently there is no way to access the following information you pass as options to wrk, from inside the lua script.
-c, --connections: total number of HTTP connections to keep open with
                   each thread handling N = connections/threads
-d, --duration:    duration of the test, e.g. 2s, 2m, 2h
-t, --threads:     total number of threads to use
So we are recording these three variables as metadata of test runs, to distinguish the runs for easier comparison and trending analysis after the results are saved to a JSON store (Cloud Firestore).
Let's assume in the end we write a shell script where three variables $connections, $duration, $threads are available which holds information for the above wrk options, then we can write down metadata to result_metadata.json:
#In the ISO 8601 format of '2018-10-21T15:59:45+09:00'
current_time=$(date -Iseconds)

echo "{ \
  \"metadata\": { \
    \"execution_time\":   \"$current_time\", \
    \"connections\":      $connections, \
    \"duration_seconds\": $duration, \
    \"num_threads\":      $threads \
  } \
}" > result_metadata.json
and merge the two JSON files into result.json.
jq -s '.[0] * .[1]' result_metadata.json result_intermediate.json > result.jsonCloud Firestore
Now we created result.json for the benchmark result, and are ready to save it in Cloud Firestore.
Actually whatever online JSON storage which is fine for you. I chose Cloud Firestore to build with, as it was easy for me. If you are not familiar with Cloud Firestore, see the following video at the Firestore product page.
Firebase products also have a rich set of tutorial videos at YouTube. By the way, I'm a big fun of learning technologies by videos, and trust me, the Firebase YouTube videos are best-in-class quality.
There are a lot of ways to persist data to Firestore - client libraries, REST API, and the Admin SDK. Among them, we use the Admin SDK here, which makes things easier, assuming we are running the benchmark in a secured environment and can access to the Firestore admin credentials to get admin-level write access to Firestore.
If you don't use the Admin SDK, things get relatively involved. Client libraries need you configure Firestore permission beforehand for write access. And the REST API requires much more - you go through the OAuth workflow to get access token before saving results. The Admin SDK makes it easier.
To use the Admin SDK, we need credentials. As described from 2:08 from the above video, you can download the credentials from the Firebase web browse console. Note that each credentials can only be downloaded once with the Generate new private key button.
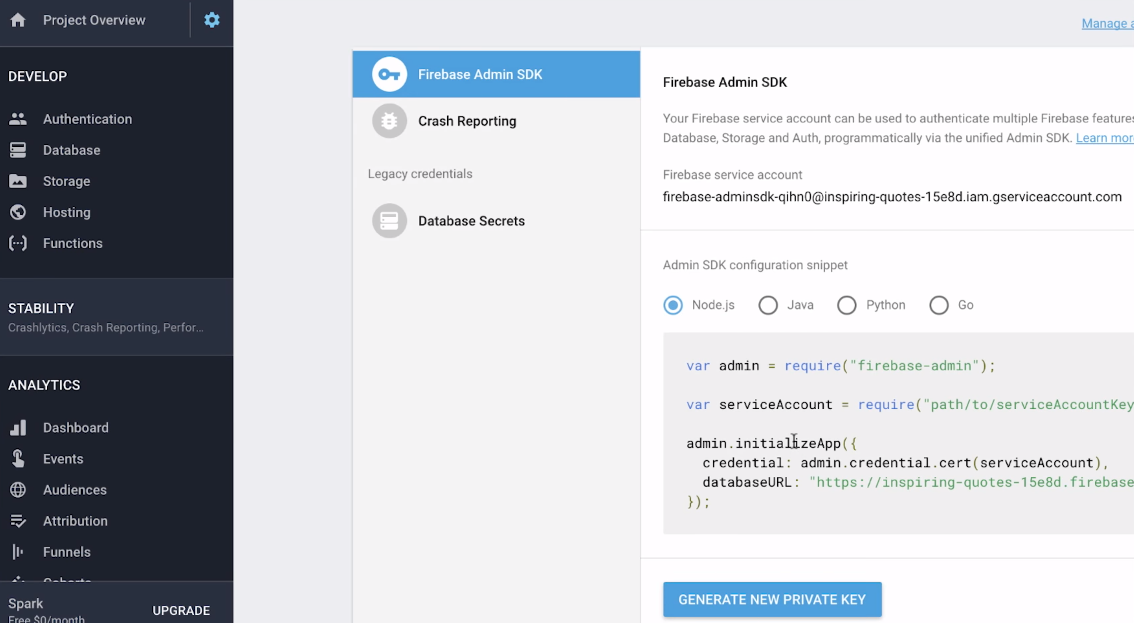
Name the credential file as ServiceAccountKey.json and store it in your current directory.
Next, you need to npm init:
> npm initAnd answer to the questions like below (other than the entry point, they are the default answers):
name: (wrk-and-firestore)
version: (1.0.0)
description:
entry point: (index.js) upload-to-firestore.js
test command:
git repository:
keywords:
author:
license: (ISC)
That creates a package.json file. You can then do:
> npm install --save firebase-adminAnd package.json should be updated like below:
{
  "name": "wrk-and-firestore",
  "version": "1.0.0",
  "description": "",
  "main": "upload-to-firestore.js",
  "dependencies": {
    "firebase-admin": "^6.1.0"
  },
  "devDependencies": {},
  "scripts": {
    "test": "echo \"Error: no test specified\" && exit 1"
  },
  "author": "",
  "license": "ISC"
}
Finally create the following upload-to-firestore.js file.
const admin = require('firebase-admin');
const fs = require('fs');

var serviceAccount = require('./ServiceAccountKey.json');

admin.initializeApp({
  credential: admin.credential.cert(serviceAccount)
});

var db = admin.firestore();
db.settings({timestampsInSnapshots: true});

var collection = db.collection('performance-tests');

fs.readFile('result.json', 'utf8', function(err, contents){
  collection.add(JSON.parse(contents));
});
That's it!
Now everything is ready! Create a shell scripte like we saw earlier and name it wrk-and-firestore.sh. The complete files are available at my GitHub directory with the brief version of the instruction to run the workflow.
./wrk-and-firestore.sh -t 5 -c 10 -d 5 http://localhost:8080It's a building block for the next step, to containerize everything to run benchmark portably in different environments easily. I'll introduce more techniques about containerization in the next article.